


August 20, 2026
Data warehousing marketing: Centralize data, gain insights, boost ROI
Let's be honest, data warehousing marketing is just a fancy term for getting all your marketing data in one place. It's about finally connecting the dots between your Google Ads, Salesforce CRM, website analytics, and social media platforms to see the entire customer journey, not just scattered pieces of it.
This is how you stop guessing and start making decisions based on the full picture.
Why Your Marketing Team is Probably Flying Blind Without a Data Warehouse

Does this sound familiar? You're drowning in a sea of spreadsheets, constantly jumping between platform dashboards, and spending half your week just trying to pull numbers for a report. By the time you piece it all together, the data is already old news. It's a frustrating cycle that makes calculating a trustworthy ROI feel almost impossible.
When your data is fragmented like this, it creates some very real—and expensive—problems:
- Clueless Attribution: You can't confidently say which campaigns are actually driving sales, which means you're almost certainly wasting ad spend.
- Shallow Customer Profiles: You see a prospect’s clicks in Google Analytics, but you have no idea they're a high-value customer in your CRM. You're missing massive opportunities.
- Constantly Playing Catch-Up: Manual reporting keeps you looking in the rearview mirror, reacting to what happened last month instead of shaping what happens next.
A data warehouse cuts through this chaos by creating a single source of truth. It’s no wonder the global data warehousing market is exploding, growing from $13 billion in 2018 and on track to hit $37.4 billion by 2025. For marketers, this isn't just a trend—it's the ticket to moving from messy spreadsheets to automated, insightful dashboards that actually help you win.
The Real-World Shift from Chaos to Clarity
Here's a look at how daily marketing operations fundamentally change once you have a central data warehouse in place.
Marketing Operations Before vs After a Data Warehouse
| Marketing Function | Before Data Warehouse (Siloed Approach) | After Data Warehouse (Unified Approach) |
|---|---|---|
| Reporting & Analytics | Manual, time-consuming data pulls from multiple platforms. High risk of human error. | Automated, near real-time dashboards. Everyone works from the same trusted data. |
| Performance Attribution | "Last-click" models dominate. Inability to see the full customer journey. | Sophisticated multi-touch attribution models are possible. Clear line of sight into channel ROI. |
| Customer Segmentation | Basic segmentation based on data from a single tool (e.g., email list). | Rich, multi-dimensional segments based on behavior across web, ads, and CRM data. |
| Team Collaboration | Sales and marketing argue over lead quality and whose numbers are "right." | Both teams analyze the same unified customer data, leading to aligned goals and strategy. |
| Strategic Planning | Decisions are reactive and based on historical, often outdated, information. | Proactive, forward-looking strategies informed by predictive analytics and trend analysis. |
Adopting a data warehouse isn't just a technical upgrade; it’s a strategic one that gets your teams out of the "who's right?" debate and into productive, data-backed conversations.
A data warehouse empowers your team to ask much smarter questions. You stop asking "How many clicks did this ad get?" and start asking, "Which combination of touchpoints leads to our highest lifetime value customers?" That's the real game-changer.
This newfound clarity also unlocks more advanced capabilities. For example, a powerful marketing automation API can pipe user interaction data directly into your warehouse in near real-time. This lets you trigger automated workflows, like sending a perfectly timed follow-up email based on someone's recent browsing history.
Ultimately, it's about building a smarter, more efficient marketing engine that proves its value to the bottom line.
Defining Your Goals and Mapping Your Data Sources
Before you touch a single line of code or sign up for a new tool, we need to talk about the most important step: figuring out what success actually looks like. I've seen too many data warehouse projects start with vague ambitions like "we need better insights." That's a recipe for a project that costs a lot and delivers very little.
A data warehouse without clear goals is just an expensive, directionless database.
You have to translate those broad business objectives into specific, measurable marketing key performance indicators (KPIs). This is where you turn fuzzy ideas into a concrete project scope.
For instance, a goal like "improving ad spend efficiency" is a good start, but it's not actionable. A powerful KPI is something like: "Reduce customer acquisition cost (CAC) by 15% on paid social channels within the next six months." Now that gives you a clear target. It immediately tells you what data you need (ad spend, conversions, customer data) and exactly what your dashboards have to track.
From Business Goals to Concrete KPIs
Get your marketing, sales, and even product teams in a room (virtual or otherwise). The goal is to build a "question map" that links what the business needs to what the data can provide.
Start high-level and drill down. Think about the questions that keep coming up in meetings that nobody can currently answer.
- Business Goal: We need to increase customer lifetime value (LTV).
- The Real Question: Which marketing channels are actually bringing in our best customers—the ones who stick around and spend more over 12 months?
- Data Needed: You'll have to pull from ad platforms (costs, clicks), your web analytics (sessions, user behavior), and your CRM or sales database (purchase history, customer tenure).
- Business Goal: Marketing and sales are completely siloed.
- The Real Question: What's our MQL to SQL conversion rate, and can we see it broken down by the original campaign that brought the lead in?
- Data Needed: This requires connecting your marketing automation platform (lead scores, campaign interactions) with your CRM data (lead status, deal progression).
This exercise isn't just busywork; it's the blueprint for your entire project. It guarantees that whatever you build will directly serve the company's strategic needs.
Frame your project around the questions you can't answer today. It completely changes the conversation from a technical cost center to a strategic investment in growth.
Conducting a Comprehensive Data Source Inventory
With your goals and questions locked in, it's time for a practical data audit. You need to map out every single place your marketing data lives. This inventory is the foundation for your data warehousing marketing efforts.
Think of it like taking stock of your kitchen before you start cooking. You need to know what ingredients you have, where they are, and whether they're any good. Honestly, most teams are shocked when they realize just how many different systems are holding valuable customer information.
Your audit should document the vitals for each platform:
- Data Source: e.g., Google Analytics 4, Facebook Ads, Salesforce, Stripe.
- Data Owner: Which team or person is responsible for it? (e.g., the Paid Media team for Facebook Ads).
- Key Metrics: What crucial data does it hold? (e.g., sessions, ad spend, lead status, revenue).
- Primary Key: How do we link this data to everything else? A common identifier like
user_id,email_address, orcustomer_idis gold. - Export Method: How do we get the data out? Is there a clean API, a native connector, or are we stuck with manual CSV downloads?
As you map these sources, you’ll get a much clearer picture of the project's complexity. If you want to go deeper on the technical side of this, understanding the core principles of marketing data integration is a great next step.
Don't forget security. As you plan to pull all this sensitive customer data into one place, you have to be proactive about governance from day one. A solid production-ready big data security playbook can give you a great framework. Getting this right at the start ensures the foundation you're building is not only powerful but also secure and compliant.
Choosing Your Modern Marketing Data Stack
Feeling overwhelmed by all the tech choices out there? You're not alone. Let's cut through the noise. A modern marketing data stack isn’t some monolithic piece of software you buy off a shelf. It’s actually a combination of three core components working together.
Think of it like building a world-class kitchen. You need a big, reliable refrigerator to store all your ingredients (that's your data warehouse). You need a set of sharp knives and a food processor to prep everything (your ETL tool). And finally, you need a skilled chef with a beautiful set of plates to turn it all into a delicious meal (your BI platform).
Each part has a specific job, and you really do need all three to make it work.
The Three Pillars of a Marketing Data Stack
Let's quickly break down what each of these components does in your data warehousing marketing setup.
- Cloud Data Warehouse: This is the foundation, the central hub for everything. It’s a powerful, cloud-based database built to handle massive amounts of data from all your different marketing channels.
- ETL/ELT Tool: This is the plumbing. It stands for Extract, Transform, Load (or its more modern cousin, Extract, Load, Transform). This tool is responsible for pulling data from platforms like Google Ads and Salesforce, cleaning it up, and piping it into your warehouse.
- Business Intelligence (BI) Platform: This is the fun part—the "front-end" where most marketers live. A BI tool connects to your warehouse and lets you build interactive dashboards, create charts, and explore all that clean data without having to write a line of code.
Once you get these roles, the next step is picking the right tools for your team's budget, goals, and technical comfort level.
Selecting Your Cloud Data Warehouse
Your data warehouse is the most important decision you'll make. It dictates everything from cost to performance down the line. The good news? The major players are incredibly powerful and more accessible than ever. It's no surprise that 94% of small organizations are already using the cloud for storage.
Market leaders like Snowflake have grabbed about 35% of the cloud warehouse market, with competitors like Amazon Redshift at 20% and Google BigQuery holding between 12-28%. For us marketers, these platforms are the key to blending data from emails, social media, and ads to create much smarter, more personalized campaigns. You can dive deeper into these market trends here.
So, which one is right for you?
- Google BigQuery: This is often the easiest on-ramp, especially if your world already revolves around Google Ads and Google Analytics. It’s serverless, which means you only pay for the queries you run, not for idle time. That can be a huge cost-saver for smaller teams just getting started.
- Snowflake: Known for its raw power and flexibility. The killer feature is its clean separation of storage and computing costs, so you can scale them independently. This is perfect for teams with "spiky" workloads, like running massive reports at the end of the month.
- Amazon Redshift: A true powerhouse and a no-brainer if your company is already an AWS shop. It might require a bit more hands-on management, but it delivers incredible performance for the price.
The G2 Grid below gives you a sense of how real users rate these platforms.
It’s pretty clear why platforms like Snowflake, BigQuery, and Databricks are in that "Leaders" quadrant. They have high customer satisfaction and a huge market presence, making them solid, reliable choices.
Picking the Right ETL or ELT Tool
Okay, you have a warehouse. Now, how do you get your data into it? That’s where an ETL tool comes in, automating what would otherwise be a painful, manual process. Your choice here really comes down to your team's technical chops and the number of data sources you need to connect.
Here’s a look at the different flavors:
- Self-Serve, No-Code Tools: Think Fivetran or Stitch. For most marketing teams, these are a godsend. They offer pre-built connectors for hundreds of sources—Facebook Ads, Salesforce, you name it. You just log in, connect your accounts, and the data starts flowing. It's almost magic.
- Low-Code/Workflow Tools: Tools like Hevo Data or Airbyte give you more control. You can build more complex data pipelines and apply custom transformations without needing to be a full-on data engineer. Airbyte is a fantastic open-source option if you want maximum control.
- Enterprise-Grade/Custom Code: This is the "roll your own" approach using Python or other languages. It offers ultimate flexibility but requires dedicated data engineering resources—something that’s usually out of reach for small and medium-sized businesses.
For 90% of marketing teams, a self-serve tool like Fivetran is the right call. The time and engineering headaches it saves are almost always worth the subscription cost. Don't even think about building this yourself unless you have a very good reason.
Choosing Your Business Intelligence Platform
Last but not least, how are you going to look at and play with your data? Your BI tool is your window into all your hard work. The key is to find something that’s intuitive enough for the whole team to use but powerful enough for your data analyst.
- Looker Studio (formerly Google Data Studio): It's free. It's easy. It's the perfect place to start. It connects seamlessly to BigQuery and a ton of other marketing platforms right out of the box.
- Tableau: This is the industry heavyweight for a reason. It has a steeper learning curve, for sure, but the depth of analysis and the quality of the interactive visualizations you can create are second to none.
- Metabase or Superset: These are awesome open-source options. You host them yourself, which gives you more control and can lower your costs, but be prepared for some initial technical setup and ongoing maintenance.
Your first stack doesn't have to be complicated. A simple, bulletproof setup for a growing e-commerce brand could easily be Google BigQuery for the warehouse, Fivetran for ETL, and Looker Studio for BI. This combo is cost-effective, a breeze to manage, and will scale with you as your data needs get more complex.
Building Your First Marketing Data Model
Now that your data is flowing into the warehouse, it’s time to give it some structure. This is where data modeling comes in. It’s the process of taking all those raw, jumbled tables and organizing them into a logical format that makes analysis fast, intuitive, and most importantly, reliable.
Think of it as creating a clean, well-organized filing system for all your marketing insights. Without a solid model, you’re just digging through a messy pile of data. With one, you can finally answer those complex questions that always seemed just out of reach.
Demystifying the Star Schema for Marketers
For most marketing analytics, the star schema is the perfect place to start. The name might sound a little nerdy, but the concept is actually pretty simple and visual. Imagine a central table—your "fact" table—surrounded by several "dimension" tables, kind of like a star.
- Fact Table: This is the heart of your model. It contains the core events or numbers you want to measure, like conversions, sessions, or ad spend. It’s mostly just numbers and IDs that link out to your dimension tables.
- Dimension Tables: These tables provide the context—the "who, what, where, and when"—for everything happening in your fact table. You’ll have separate dimension tables for things like campaigns, channels, customers, and dates.
This structure is incredibly powerful because it neatly separates your numerical data (the facts) from your descriptive, contextual data (the dimensions). This separation is what makes your queries so much faster and easier for anyone on the team to write and understand.
A star schema transforms your data from a tangled web into a clear map. It allows you to ask, "Show me conversions by campaign," and the system knows exactly where to look without getting lost.
A Practical Example of a Marketing Star Schema
Let's make this real. Say you want to build a model for multi-touch attribution. Your star schema might look something like this:
- Fact Table (fct_conversions): Each row represents a single conversion event.
conversion_id(Primary Key)customer_id(Foreign Key)campaign_id(Foreign Key)channel_id(Foreign Key)conversion_date(Foreign Key)revenue_amount(The metric)
- Dimension Table (dim_customers): All the details about each customer.
customer_id(Primary Key)first_nameemailltv_tier
- Dimension Table (dim_campaigns): All the details about your marketing campaigns.
campaign_id(Primary Key)campaign_namestart_datebudget
This visual shows how these pieces fit together to create a cohesive marketing data stack, from raw data all the way to your BI tool.
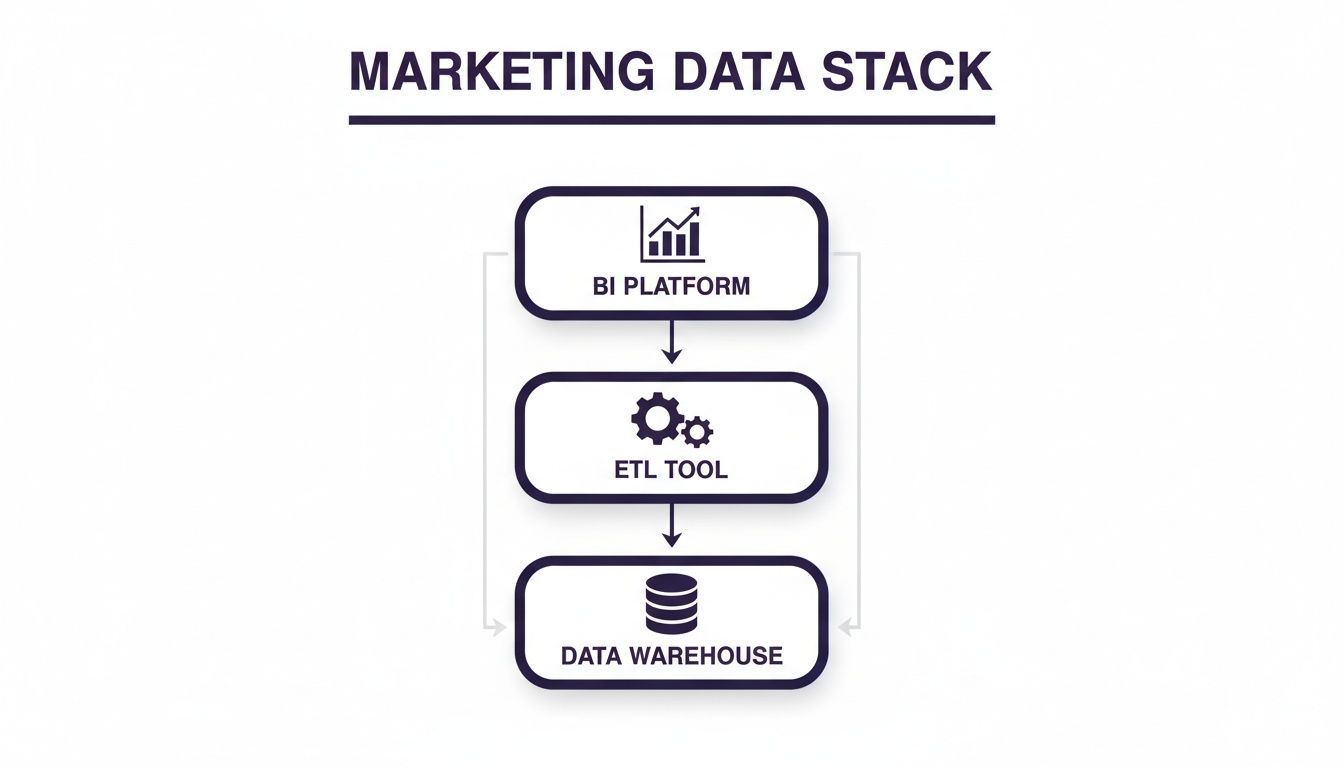
As you can see, the data flows from various sources, gets cleaned up and organized in the warehouse via your ETL tool, and is then ready for analysis in your BI platform.
From Model to Insight With Sample SQL
Here’s where the magic happens. With this model in place, you can write simple SQL queries to join these tables and pull incredibly powerful insights. This is how you empower yourself to get answers on the fly, without having to wait in line for an engineering ticket. To dive deeper into the strategy, check out our guide on modeling in marketing.
With your new model, answering critical business questions becomes straightforward. The table below provides a few examples of how you can query your star schema to get actionable marketing data.
| Sample SQL Queries for Marketing Attribution |
|---|
| Marketing Question |
| Which marketing channels delivered our highest LTV customers last quarter? |
| What was the total revenue generated from the "Summer Sale 2024" campaign? |
| How many unique customers converted via email marketing in May? |
That first query, for instance, instantly connects revenue from your fact table with customer and channel details from your dimension tables. It's this ability to easily join separate datasets that makes data modeling a non-negotiable step. It’s the bridge between raw data and strategic action.
Bringing Your Data to Life: Dashboards and Deeper Insights

You’ve done the heavy lifting. The data is clean, modeled, and sitting in your warehouse, ready to go. This is where the real fun begins—turning all that structured data into the kind of strategic insight that gives you a genuine competitive edge.
It's time to move past clunky, siloed reports and start building a clear, unified view of your marketing performance.
First up, you’ll connect a BI tool like Tableau, Looker, or the surprisingly powerful (and free) Looker Studio directly to your warehouse. This connection is the key to unlocking visualizations you simply couldn't create before.
Building Your Core Marketing Dashboards
The goal here isn't to just replicate every chart from every ad platform. That's a trap. Instead, you want to build a few high-impact dashboards that tell a complete, cross-channel story. I’ve found that starting with these two provides the most immediate value.
- The Marketing Command Center: Think of this as your mission control. It should give you a live pulse on your most critical KPIs against your targets—things like overall Customer Acquisition Cost (CAC), total Marketing ROI, and key conversion rates. The game-changer? These metrics are all calculated from your single source of truth, finally putting an end to those "Which report is right?" debates.
- The Unified Attribution Report: This is where you connect the dots between spend and revenue. By pulling ad platform data (Google, Meta, etc.) and sales data into one view, you can finally compare channel performance apples-to-apples. Visualizing metrics like CPA and ROAS using a consistent model across every channel is a massive win.
Stop building dashboards just for the sake of it. Before you create any new chart, ask yourself one simple question: "What specific decision will this help us make?" If you don't have a clear answer, it doesn't belong on your main dashboard.
Crafting visuals that are both beautiful and easy to understand is its own skill. If you want to make sure your insights land with your team, brushing up on a few data visualization best practices will pay off big time.
Going Beyond Reports to Real Analysis
Dashboards are great for keeping an eye on things, but the true power of a marketing data warehouse is its ability to answer your toughest strategic questions. With all your data in one place, you can finally dig into the complex analyses that were always just out of reach.
This is the shift from reacting to performance to proactively shaping it.
Unlocking a Deeper Read on Your Customers
Here are a few of the high-impact analyses that a proper data warehouse finally makes possible:
- Multi-Touch Attribution (MTA): You can finally break free from the deeply flawed "last-click" model. By stitching together the entire customer journey from first touch to final sale, you can build smarter models (like U-shaped or time-decay) that give credit where it's due—from that first blog post they read to the retargeting ad that sealed the deal.
- Cohort Analysis: This is a must for any subscription or repeat-purchase business. Grouping customers by sign-up month lets you track their behavior and value over time. You can definitively answer questions like, "Did the customers we acquired during the Black Friday sale have a higher Lifetime Value (LTV) than our summer cohort?"
- Predictive Lead Scoring: By joining marketing engagement data (website visits, email opens) with sales outcomes from your CRM, you can build a lead scoring model that actually predicts who will buy. You can pinpoint the exact behaviors—like visiting the pricing page three times and downloading a specific case study—that signal a hot lead, helping sales focus their energy where it matters most.
These are the kinds of analyses that separate the good marketers from the great ones. They give you the clarity to invest your budget with near-surgical precision, understand your customers on a much deeper level, and prove the massive impact your team has on the bottom line.
Managing Costs and Planning Your Rollout
Moving to a centralized data warehouse is a serious strategic investment, not just a technical one. If you don't nail down the costs and plan a smart rollout, your project can easily spiral into an expensive science experiment with little to show for it.
Let's get practical and break down how to make this initiative a success from both a budget and execution standpoint.
Breaking Down the Budget
When you're budgeting for a project like this, you have to look past the shiny software licenses. The real cost comes from a mix of technology, talent, and time.
For most marketing teams, this means budgeting for a few key pieces. You'll have your ETL tools (expect to spend $13k–$50k annually), the warehouse itself (around $400 per TB per year), and your BI tools (another $3k–$10k). The biggest line item, though, is often the data team salaries, which can run anywhere from $400k–$800k a year.
It sounds like a lot, I know. But modern platforms like Snowflake have changed the game with consumption-based pricing and near-zero maintenance, making this kind of setup far more accessible. You can dig a bit deeper into these modern data warehouse costs and considerations to see how the numbers add up.
This model lets you start small and scale your spending as your data and analysis needs get more complex.
Think of your data warehouse costs like a utility bill, not a mortgage. You pay for what you use, which gives you incredible control and prevents you from over-investing before you’ve proven the value.
A Phased Rollout for Guaranteed Wins
Trust me on this one: a "big bang" launch where you try to connect every single data source at once is a surefire recipe for failure. It's too complex, too slow, and you'll lose momentum before you get anywhere.
Instead, you need a phased approach that builds on small, early wins. This minimizes risk and, more importantly, gets your stakeholders excited and bought-in from the very beginning.
Here’s a battle-tested rollout plan that just works:
-
Pilot Project (Weeks 1-4): Start small but aim for high impact. Connect just two or three core data sources—think Google Ads, Google Analytics, and your CRM. Your goal is to answer one critical business question, like calculating a true cross-channel CPA. This proves the concept and gets you that crucial first win.
-
Core Dashboard Buildout (Weeks 5-8): Now that you have some momentum, it's time to expand. Bring in other key sources like your email platform and social media ad accounts. This is when you'll focus on building those foundational dashboards we talked about earlier, like the "Marketing Command Center" and the "Unified Attribution" view.
-
Team Enablement (Weeks 9-12): Time to get the rest of the team involved. Run workshops and training sessions to get everyone comfortable using the BI tool and interpreting the new dashboards. The goal here is cultural: shift from a world where people ask for reports to one where they can pull their own insights.
-
Full Deployment & Optimization (Ongoing): With the foundation in place, you can keep layering on more. Add secondary data sources and build out more specialized dashboards for different teams (content, SEO, etc.). Now you can start exploring the really cool stuff, like cohort analysis and predictive lead scoring.
Following a plan like this turns a daunting project into a series of manageable steps, building confidence and delivering real, measurable results along the way.
A Few Lingering Questions
Even with the best roadmap, a few questions always pop up along the way. Let's tackle some of the most common ones we hear from marketing teams diving into data warehousing for the first time.
How Much Technical Mumbo-Jumbo Do I Really Need to Know?
Honestly, not as much as you'd think. The game has changed. Modern no-code ETL tools like Fivetran and intuitive BI platforms like Looker Studio have brought the technical bar way down. Marketers don’t need to become data engineers overnight.
Your job is to bring the business context. Know your goals, ask the right questions, and be the one who can look at a dashboard and see the story. The heavy lifting of keeping the data flowing? Leave that to the tools and your more technical colleagues.
So, What's the Real Timeline Here?
This isn’t a weekend project, but it shouldn't drag on for a year, either. If you plan it right, a pilot project focusing on just two or three core data sources can get you a genuinely useful first dashboard in about 4-6 weeks. A more ambitious, company-wide rollout might take closer to 3-4 months.
The secret is to think in phases. Go for small, quick wins first. Get something valuable in front of the team to build momentum and prove the concept. Don't try to boil the ocean by connecting every single data source from day one.
Can't We Just Do All This in Google Analytics 4?
Look, Google Analytics 4 is an absolute beast for what it does—analyzing user behavior on your digital properties. But it’s not a data warehouse. It was never designed to be the central hub for all your business data.
GA4 can't, for instance, natively join its web data with your Salesforce CRM records, your TikTok ad spend, or the actual sales figures from your payment processor.
The right way to think about it is that GA4 is a critical data source that feeds into your warehouse. To get the full picture, you need that central repository to blend every stream together. That’s the core of marketing data warehousing.
Ready to build a marketing strategy powered by unified data, not guesswork? The team at Frozen Crow Inc. specializes in creating data and analytics solutions that drive measurable growth. Get your free marketing audit today and discover how we can help you turn scattered information into your most powerful asset.


